
A single performance score can hide what actually happened. Effective CTV performance measurement brings together event counts, task results, execution contexts, performance entries, marks, and measures to show how work unfolded and where timing data came from.
It’s easy to focus on whether a task succeeded and miss the context behind the result. Timing and interaction data add detail. For example, the Performance.now() method returns a high-resolution timestamp in milliseconds elapsed since a reference instant.
This guide explains how to read each measurement type and what it can tell you. You’ll learn how event counts differ from task results, why execution context matters, what performance entries record, and how marks and measures describe a specific stretch of work. The goal is a clearer, more useful view of performance, not a number without context.
Key Takeaways
- Separate event and interaction counts from task outcomes to see what happened, not just whether a task finished.
- Use execution context to understand where performance data comes from and how to interpret it.
- Apply marks and measures to define meaningful intervals and examine specific parts of an application’s work.
- Assess streaming reach and frequency with attention to how platforms identify audiences and account for repeat exposure.
- Consider how a tangible mail piece can complement a streaming campaign when you want to extend its impact beyond the screen.
Event counts and interaction counts
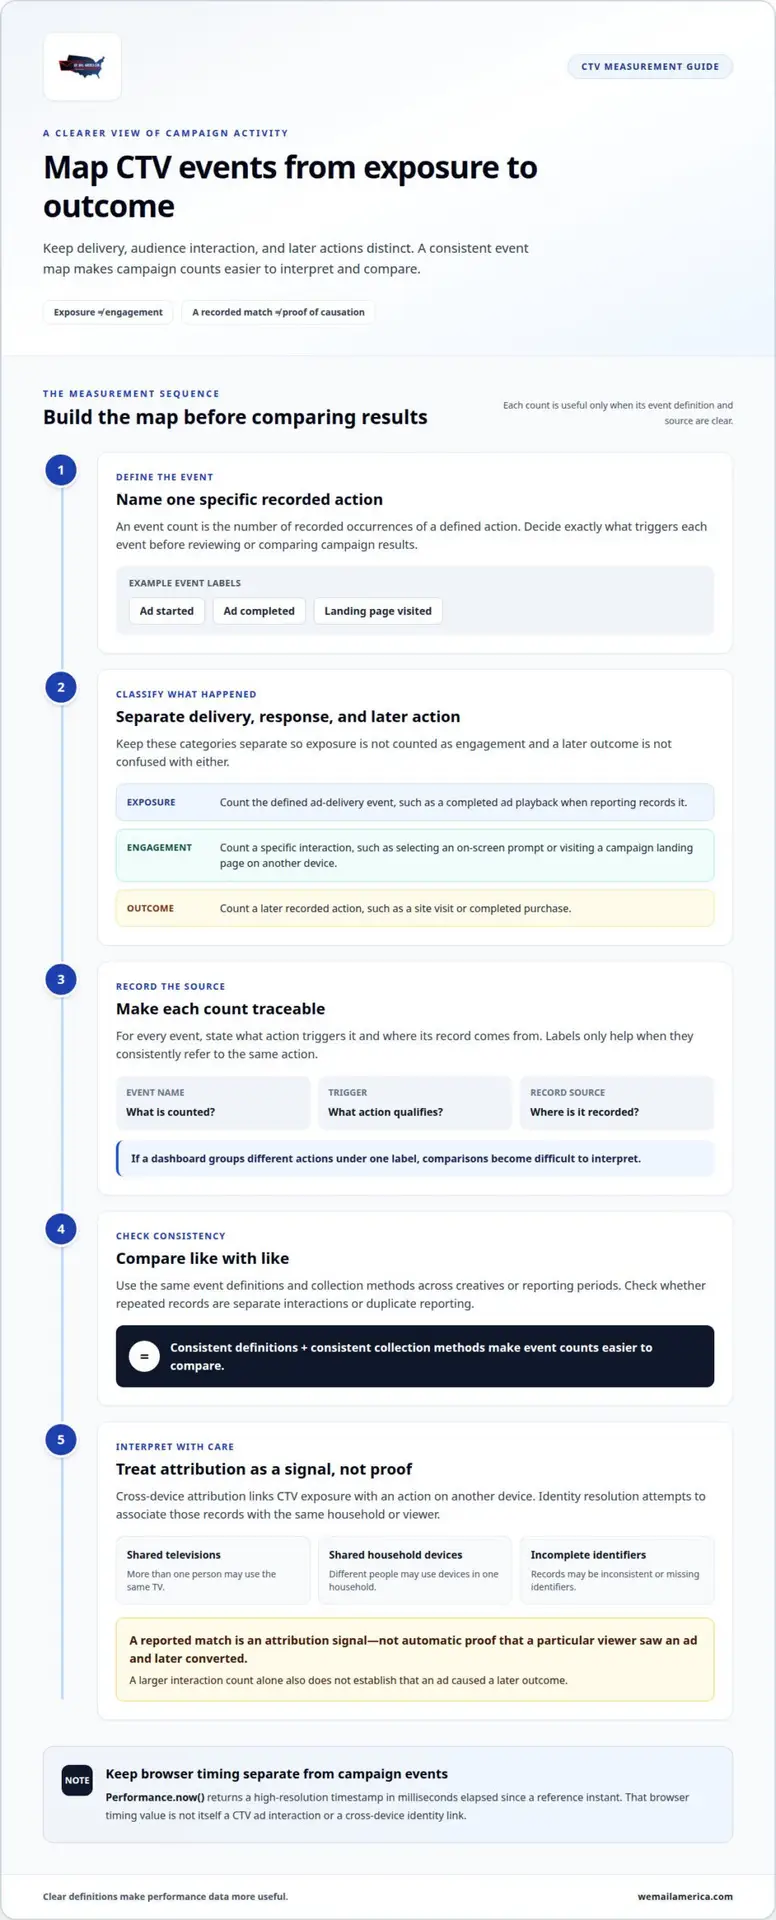
An event count is the number of recorded occurrences of a defined action. In a CTV campaign, an example might be a completed ad playback, if the reporting setup records that event. Counts show volume, but they don’t explain who acted or what happened afterward. Define each event before comparing campaign results.
An interaction count totals recorded responses to an ad or its related experience. Examples include a viewer using a remote to select an interactive prompt or visiting a campaign landing page on another device. These actions differ from an ad impression or playback. Keep them in separate categories so the report doesn’t treat exposure as engagement.
Build a simple event map before reviewing results. Name each event, state what action triggers it, and identify where its record comes from. For example, a campaign might distinguish “ad started,” “ad completed,” and “landing page visited.” Those labels are useful only when each consistently refers to the same action. If a dashboard groups different actions under one label, comparisons become difficult to interpret.
- Exposure: Count the defined ad-delivery event.
- Engagement: Count a specific interaction, such as selecting an on-screen prompt.
- Outcome: Count a later action, such as a site visit or completed purchase, when that action is recorded.
These categories separate what the campaign delivered from how people responded. They also make event counts easier to compare across creatives or reporting periods, provided event definitions and collection methods remain consistent. A larger interaction count alone doesn’t establish that an ad caused a later outcome.
Cross-device attribution links CTV exposure with an action on another device; identity resolution attempts to associate those records with the same household or viewer. Common challenges include shared televisions, multiple people using one household’s devices, and incomplete or inconsistent identifiers. A reported match is therefore an attribution signal, not automatic proof that a particular viewer saw an ad and later converted.
For practical analysis, review the event definition, its source, and the relationship between exposure and later action. Check whether repeated records represent separate interactions or duplicate reporting. The Performance.now() method returns a high-resolution timestamp in milliseconds elapsed since a reference instant, but that browser timing value is not itself a CTV ad interaction or cross-device identity link. Keep technical timing measures separate from campaign event counts.
Performance as how well a task is done
Task performance describes how well a person or machine completes a defined activity. In CTV advertising, assess a task against its intended result, such as playing an ad, loading a landing page, or recording a conversion.
A task needs a clear finish line before you can judge its performance. For an ad-delivery task, the goal might be completed playback. For a landing-page task, it might be a page that loads and displays its main content. These are separate tasks, so one successful result doesn’t prove the other succeeded.
CTV performance measurement becomes more useful when each metric connects to a specific task. A playback count describes delivery activity. A completion rate describes how often tracked playback reaches its defined endpoint. A conversion count describes recorded outcomes, such as a submitted form. These measures answer different questions, so avoid combining them into one undefined score.
Choose measures that reflect the campaign objective. For awareness, review delivery and playback completion. For a site-visit objective, examine recorded visits alongside ad exposure. For a purchase objective, consider whether transaction records can be connected to campaign activity. A report should make the task, evidence, and interpretation clear.
Use this sequence to evaluate a task:
- Define the action: Specify what counts, such as an ad reaching its playback endpoint.
- Choose the evidence: Identify the recorded event that shows the action occurred.
- Compare like with like: Review the same task definition across creatives or campaign periods.
For example, a creative with fewer completed plays may still prompt more landing-page visits. That pattern can signal a difference between delivery and response, but it doesn’t establish why the difference occurred. Check whether both measures use consistent definitions, comparable reporting windows, and relevant attribution rules. State what the records show, then distinguish that observation from any explanation.
Task performance also includes execution quality. A video task may complete while the viewer experience still suffers from delayed playback or an unresponsive interactive element. Treat these as distinct technical tasks. Define what “working” means for each, then examine the evidence tied to that task. This keeps a successful delivery metric from masking a weak experience.
For campaigns that pair CTV with a measurable response, discuss campaign objectives and identify which outcomes matter before reviewing results.
In information technology, performance can describe how well a computer or machine works. Applied to CTV measurement, that idea focuses attention on a system’s ability to carry out a defined action, rather than on a single headline metric. A report can distinguish whether the machine completed the task from whether the task met the campaign’s intended result. For example, playback may be recorded as complete while an interactive element does not respond; these observations concern different forms of task performance. Describe the evidence for each action directly, and avoid treating technical operation as proof of audience response. Explicit criteria make it easier to interpret what succeeded, what did not, and what remains uncertain.
Performance entries and execution contexts
A performance entry is a record describing a specific performance event or timing. In browser code, entries help show what happened during a page or application task. They are not the same as campaign impressions, completed views, or conversions. Use them to examine technical behavior, then keep those findings separate from advertising delivery data.
An execution context is the environment where a particular piece of code runs. Performance entries belong to their execution context, so data from one context does not automatically describe another. For example, a streaming app may run code in a window and separate work in a worker. Each can produce distinct performance information.
For window code, the browser exposes performance information through Window.performance. Worker code accesses it through WorkerGlobalScope.performance. Keep these sources identifiable in logs. Otherwise, a timing record from background work could be mistaken for a delay in the visible interface. This distinction matters when investigating an app that plays video while also loading menus or processing user input.
When reviewing an entry, connect it to the code path and user-facing action it describes. For example, if a menu responds slowly, compare the window’s recorded activity with relevant worker activity. This can help narrow the investigation to rendering, background processing, or communication between components. The entry provides technical context, not a complete explanation of the viewer’s experience.
Performance.navigation is a legacy object that provides context about page loads, refreshes, and redirects. It can help interpret older instrumentation, but it should not be mistaken for a full account of current CTV campaign performance. A redirect recorded during a page flow, for example, describes navigation behavior. It does not establish that an ad caused a visit or conversion.
- Identify the context: Record whether data came from window code or worker code.
- Match the entry to a task: Tie it to a visible action, such as opening a menu.
- Separate technical and campaign data: Keep runtime timing distinct from delivery and outcome reporting.
These steps make technical diagnostics easier to interpret without overstating what they prove. If a CTV app’s menu stalls while video continues, an entry may help locate the work involved. It cannot, by itself, measure reach, frequency, or return on ad spend. For a broader campaign review, outline your CTV campaign objectives alongside technical findings.
That separation also offers a practical rule for collecting and comparing records: retain the execution context with each performance entry instead of treating all timings as one shared stream. Performance entries are specific to each execution context, and performance information is available through Window.performance for window code and WorkerGlobalScope.performance for worker code. A comparison is useful only when records are interpreted in the context that produced them. Otherwise, a timing from one part of the app may be assigned to work happening in another. Keep the context visible as findings move from investigation to reporting, and describe what an entry supports without turning it into a claim about a different task or outcome.
When reviewing a suspected delay, first identify whether the relevant code ran in the window or a worker, then interpret its entries within that context. This preserves the distinction between separate tasks and avoids treating different records as interchangeable evidence.
Performance marks and measures
A performance mark records a named point in an application’s timeline; a measure describes an interval between points. In campaign reporting, use these technical tools to investigate application behavior, not as substitutes for audience or sales metrics.
CTV and Linear TV Measurement
CTV measurement tracks advertising delivered through connected streaming devices, while linear TV measurement assesses scheduled television broadcasts. CTV reports can use digital delivery and device-level signals; linear reports commonly describe audiences against programming and time slots. Compare results only after aligning definitions of exposure, audience, and reporting period. A platform’s impression count and a program’s audience estimate aren’t automatically equivalent.
Performance marks add a different layer. For example, a developer can mark when a streaming app begins loading an ad experience, then measure the interval until playback starts. That duration describes app execution, not the number of viewers reached. Keeping these measurement types separate prevents technical timing from being mistaken for campaign impact.
Privacy Rules and Measurement Costs
Privacy practices shape which audience signals a CTV measurement plan collects and how those signals are used. In the United States, teams should account for applicable privacy requirements, user choices, data minimization, and clear handling of identifiers. Specific obligations depend on the data and circumstances; don’t treat one measurement setup as a universal rule.
CPM means cost per thousand impressions, while measurement costs cover the services or tools used to report results. There is no single typical CPM or measurement fee across campaigns. Pricing depends on factors such as inventory, targeting, reporting scope, and measurement method. Compare proposals by separating media charges from measurement charges.
Reach and Frequency Measurement
Reach estimates the number of distinct people or households exposed; frequency describes how often each is exposed. Across streaming platforms, deduplicating audiences depends on available identifiers and the method used to connect records. Shared televisions and separate platform data can complicate comparisons. Review each report’s audience unit and deduplication approach before combining platform totals.
Delivery verification checks whether ads were recorded as served, while completion rates track the defined playback endpoint. Viewability describes whether an ad had an opportunity to be seen under the measurement method used. These terms aren’t interchangeable. A dashboard should label each metric, identify its source, and clearly show the reporting period.
Attribution, Conversions, and Sales Lift
CTV attribution connects ad exposure with a later recorded action, such as a site visit or purchase. Sales lift compares sales outcomes between an exposed group and a comparison group. Interpret both alongside the method, matching signals, and measurement window. A conversion linked to exposure alone doesn’t prove the ad caused it.
Incrementality asks whether advertising produced outcomes beyond what would otherwise have happened; brand lift evaluates changes in brand-related responses. A measurement plan should define its audience, objective, conversion event, reporting window, and comparison method. Build the dashboard around those choices. Identify data sources, label marks and measures separately, and show delivery, reach, frequency, and outcomes without blending unlike metrics. Provider and platform choices vary by campaign setup, available data, and reporting needs, so compare methods and outputs against the plan. When translating these metrics into a broader commercial strategy, agencies like Stratagon help brands craft customer-centric campaigns designed to drive measurable revenue growth.
How is CTV reach and frequency measured across streaming platforms?
Reach counts distinct audience members or households exposed; frequency describes exposure repetition. Across streaming platforms, advertisers compare platform reports, align audience definitions, and account for overlapping viewers. The key is to understand how each report creates its totals before combining them.
Start by choosing the campaign’s audience unit: people, households, or devices. A household-based report can count a shared television differently from a person-based report. For example, several viewers watching one connected TV may appear as one household exposure. Keep the chosen unit consistent across platforms, or comparisons won’t describe the same audience.
Next, review each platform’s reported reach and frequency separately. Record the reporting period, eligible inventory, audience unit, and any exclusions. Then examine overlap. A household watching the same campaign through two streaming services could appear in both platform totals. Adding those totals without deduplication can overstate campaign-wide reach.
Cross-platform deduplication attempts to recognize overlapping audience records and count them once. The result depends on available identifiers and the method used to connect records. For instance, a shared television, a personal phone, and a laptop may not resolve to one household consistently. Treat combined reach as a methodology-based estimate, and keep platform-level figures visible for context.
Use this reporting workflow to make the comparison more useful:
- Set the scope: Define the campaign period, platforms, audience unit, and eligible ad exposure.
- Review platform reports: Capture reach and frequency separately for each service.
- Check overlap treatment: Record how the combined report handles repeated audience identities.
- Compare delivery patterns: Look for audience duplication or uneven exposure across platforms.
- Document limitations: Label estimates and keep the methodology beside the reported totals.
Frequency needs context, not just a campaign-wide average. One average can hide a group with repeated exposure and another with limited exposure. Where reporting allows, compare frequency distributions across platforms or audience segments. Then interpret those patterns alongside creative rotation and campaign goals. The same exposure level may serve an awareness objective differently from a response objective.
Before evaluating performance, confirm the reporting window matches the campaign’s delivery period. A platform report covering different dates can distort both reach and repetition. Keep the raw platform totals, combined estimate, and deduplication explanation together in the dashboard. For a campaign plan that connects audience targeting with measured delivery, discuss your CTV campaign.
We Mail America: Impact Post Card – 6 X 11
We Mail America’s Impact Post Card – 6 X 11 gives advertisers a tangible way to extend a CTV campaign into the mailbox. Consider pairing streaming exposure with direct mail when your campaign plan also calls for a physical piece that recipients can hold and keep.
Choose a format that fits your message and audience strategy. Options include the Extra Large Card – 9 X 11, Mailbox Buster Post Card – 12 X 9, and The Giant Post Card – 10 X 14. A postcard can reinforce campaign messaging, while its response can be tracked separately from streaming delivery. Keep those results distinct when reviewing performance, then assess how each channel supports your broader marketing objective.
For a direct mail campaign that complements your CTV plan, contact We Mail America to discuss your objectives.
Turn Measurement Into Your Next Campaign Decision
Make your next move specific. Decide what you want the campaign to help you learn, then use that decision to guide the audience, creative, and reporting plan. CTV performance measurement becomes more valuable when findings shape what you test next, rather than ending as a dashboard report.
Consider where a physical mail piece could support your broader marketing effort. We Mail America offers the Impact Post Card – 6 X 11, Extra Large Card – 9 X 11, and Mailbox Buster Post Card – 12 X 9. These formats give you options to discuss when planning a campaign that pairs streaming with tangible outreach.
Bring your campaign objectives and audience plans into the conversation. Contact We Mail America to discuss how direct mail could fit your marketing strategy. A clear next step can turn campaign insights into a stronger plan for what comes next.
Frequently Asked Questions
What is CTV performance measurement?
CTV performance measurement evaluates how a connected TV campaign delivers, engages viewers, and contributes to marketing objectives. It combines delivery and audience indicators with outcomes, such as visits or purchases, where those actions can be attributed. For example, a campaign team might compare ad exposure with visits to a campaign-specific landing page, then assess whether the reporting method supports that connection.
Which KPIs are used to measure CTV campaigns?
Common CTV campaign KPIs include impressions, unique reach, average frequency, video completion rate, site visits, conversions, and cost per outcome. Choose them based on the campaign goal: an awareness effort may prioritize reach, while a response campaign may focus on visits or completed actions. For a useful report, define each metric consistently and pair the KPI with its data source and attribution method.