

A delivered mail piece isn’t proof that someone opened it. That’s the key limitation behind direct mail open rates: unlike email, physical mail doesn’t report whether a recipient opened or read it. Delivery tracking can show mail progress, but it can’t confirm attention. It’s natural to want one clear percentage for campaign performance, especially when benchmarks use different definitions and methods.
A more useful measurement plan separates delivery from engagement, response, and conversion. This article explains what an open-rate figure can and can’t tell you, why reported readership benchmarks may not compare cleanly, and which trackable actions can show whether a campaign is working. You’ll also learn how a custom QR code or a postcard text response option can connect a physical mail piece to measurable customer action. The goal isn’t to pretend every interaction is visible. It’s to measure the signals that matter, using consistent definitions and tracking tied to your campaign objective.
Key Takeaways
- Direct mail open rates depend on how a source defines and estimates attention, so treat them as reported measures, not confirmed individual opens.
- Compare benchmarks only when their definitions, methods, audiences, and sources are clear and consistent.
- Choose one primary campaign objective, then define the customer action that will count as a response.
- Use a campaign-specific tracking method, such as a QR code or text response, to measure engagement and connect it to your goal.
- We Mail America supports nationwide direct mail campaigns with a custom QR code included on every campaign and a text option at no additional charge on postcards.
What Does a Direct Mail Open Rate Mean, and Can You Measure It?
A reported direct mail open rate usually means the share of delivered pieces that a source says were opened or read. The wording sounds precise, but the figure may come from an estimate, survey, or another method rather than a record of each recipient opening a piece. Before comparing figures, check how the source defines “open,” what it counts in the denominator, and how it gathered the data.
Physical mail can be delivered without producing a signal that someone has opened it. Direct marketing can prompt measurable responses, but an action after delivery isn’t the same as attention itself. A useful measurement plan keeps those events separate.
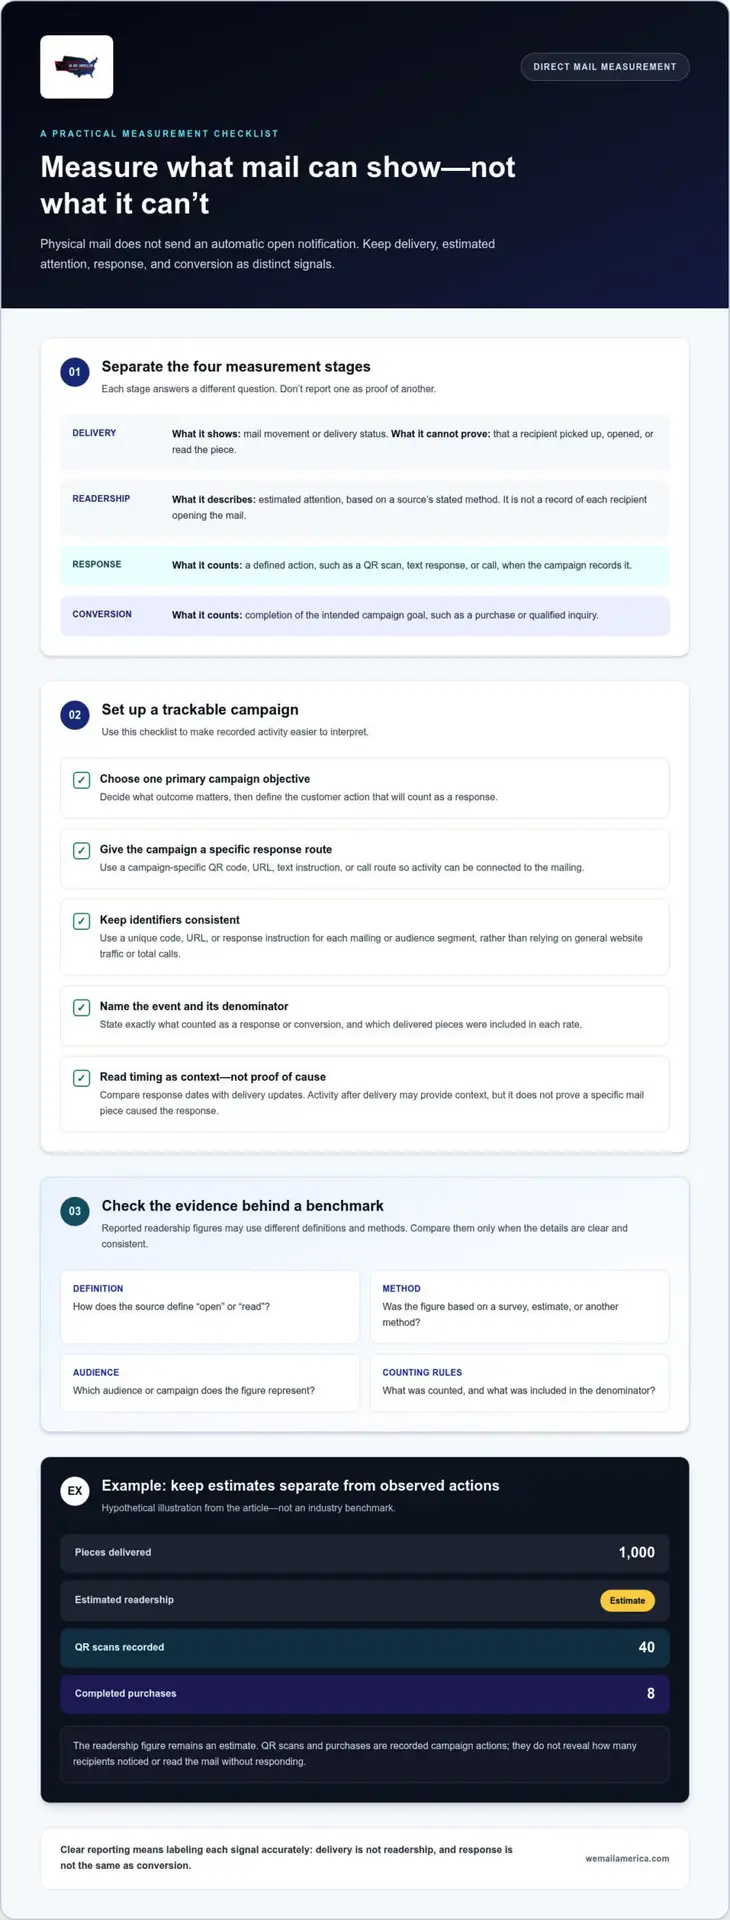
Delivery records show that mail reached a destination; readership figures estimate attention; response counts a defined action; conversion records a completed campaign goal. Keeping these measures distinct makes performance reports clearer and comparisons more meaningful.
Why physical mail does not have a built-in open notification
A delivery record concerns the mail piece’s movement or delivery status. It doesn’t confirm that a recipient picked it up, opened it, or read the message. Unlike digital channels that may record certain interactions, ordinary mail doesn’t automatically send an “opened” notification to the sender.
Reading an offer and acting on it are different events. Someone may notice a postcard but take no action, or respond later through a QR scan or text. A campaign can record those actions when it uses a trackable response method, but they still don’t reveal how many people saw or read the piece.
Open rate, response rate, and conversion rate are different
An open rate describes estimated attention, based on the source’s stated method. A response rate counts recipients who take the action the campaign defines as a response. A conversion rate counts people who complete the intended outcome, such as making a purchase or submitting a qualified inquiry. State the denominator for each metric so the calculation is clear.
For example, imagine a campaign delivers 1,000 pieces. A marketer estimates readership using a stated survey method, records 40 QR scans as responses, and counts eight completed purchases as conversions. The scans and purchases are observable campaign actions; the readership figure remains an estimate. These hypothetical numbers illustrate the distinctions, not an industry benchmark.
When reviewing a direct mail response-rate benchmark guide, look for its audience, definition, and research method. A figure is useful only when you know what action counted and which delivered pieces were included. For a foundation in the broader discipline, Direct marketing covers the practice of communicating directly with audiences and inviting a measurable response. Apply the same precision to your reporting: name the event, document how it was measured, and don’t present estimated readership as confirmed opens.
Estimating Direct Mail Attention and Tracking Engagement
A readership estimate is only as useful as the method behind it. A survey, modeled estimate, or reported benchmark may define “read” differently, so don’t treat one source’s figure as a universal measure of attention. Before using it to judge performance, check what was counted, how the information was collected, and which audience or campaign it represents.
For your own campaign, focus on observable signals. A delivery update describes mail progress. A QR scan, text response, or call can show an action if the campaign is set up to record it. These signals help you understand engagement, but they don’t reveal everyone who noticed or read the piece.
What common direct mail engagement signals can show
A QR scan records an interaction with the destination linked to that code. A text response or call can also be counted when you provide a campaign-specific route and capture those interactions. Use a unique code, URL, or response instruction for each mailing or audience segment. This makes it easier to connect recorded activity to a specific campaign instead of relying on general website traffic or total calls.
A recorded response shows that someone acted, not how many recipients read the mail without responding. No single signal captures everyone who noticed the piece. A reader might visit the destination another way, respond later, or take no action. Report each measured event accurately rather than presenting it as a complete count of readership.
What delivery tracking can, and cannot, prove
Delivery updates help show the progress of mail through the delivery process. They don’t identify whether a particular recipient opened or read a piece. The USPS Every Door Direct Mail page provides official information about a USPS direct mail option, but delivery information should still be interpreted as delivery-related, not as a readership record.
Timing adds context. Compare response dates with delivery updates to see whether activity followed the expected delivery window for the campaign. Treat that relationship as an indicator, not proof that a specific mail piece caused a response. A customer might have encountered another campaign or already planned to act.
For a clearer view across channels, connect campaign identifiers and reporting periods before comparing mail activity with screen advertising. A guide to merging direct mail and Connected TV data can help frame that analysis. Keep the source, time period, and action definition consistent so the comparison stays useful.
We Mail America provides daily tracking updates on mail delivery, which can help you interpret timing alongside recorded response activity. To build a trackable action into your next campaign, explore direct mail campaign options.
How to Compare Direct Mail Open-Rate Benchmarks Without Misreading Them
A benchmark percentage means little without its measurement rules. One source may report estimated readership, while another counts responses to an offer. Those figures describe different events, so ranking them side by side can make a campaign look stronger or weaker for the wrong reason. When reviewing direct mail open rates, first identify what the number represents and how it was produced.
Use a comparison table to record the details behind each claim. Treat it as a research worksheet, not a leaderboard. Leave a field blank if the source doesn’t provide the information rather than filling gaps with assumptions.
| Metric | Definition | Measurement method | Audience | Source |
|---|---|---|---|---|
| Reported readership | What the source counts as opened or read | Record the stated estimate, survey, or other method | Note customer, prospect, or other audience | Publication date and original research |
| Response rate | Recipients who took the defined response action | Record the response count and denominator | Note audience and campaign type | Report name, date, and research method |
| Conversion rate | Recipients who completed the intended outcome | Record the conversion event and calculation | Note which recipients were included | Source and attribution approach |
Matching metric definitions matters more than ranking isolated percentages. A readership estimate can’t be fairly compared with a response or conversion rate, even if all three appear in the same article. The 2026 Direct Mail Statistics roundup may offer useful context, but trace any benchmark you plan to cite back to its original research and check its publication date and methodology.
Questions to ask before trusting a reported rate
Start by identifying the event: estimated readership, a response, or a completed conversion. Then check the audience, campaign type, sample, and date. Look for a clear numerator and denominator. For example, does the calculation count responses among delivered pieces, mailed pieces, or another group? If the source doesn’t explain its method, label the figure as unclear instead of treating it as a comparable benchmark.
Why campaign conditions change the comparison
Audience selection, offer, creative, and response method all shape the context around a rate. A campaign to existing customers may not be comparable with prospect outreach, and saturation mail may use a different audience approach. Compare like with like where possible, and note any differences. Use a direct mail response-rate article to assess response performance, not as evidence of an equivalent open rate.
How to Measure Your Own Direct Mail Campaign Engagement
A useful measurement plan starts before the mail goes out. Pick one primary objective, then define the specific action that will count as a response. That action might be a QR scan, text response, call, or completed purchase. Keep the goal focused: if the campaign aims to generate appointments, for example, an appointment request is more relevant than a general website visit.
Direct mail open rates can’t replace this plan. A campaign can’t directly record everyone who reads a piece, but it can measure actions when you give recipients a clear way to respond. Decide what you’ll count, how you’ll identify the campaign, and how long you’ll collect results before comparing performance.
Choose a response mechanism that fits the campaign
Match the response path to the offer and audience. A QR code should lead to a landing page that makes the next step clear and useful. If a postcard’s Mail-to-Mobile text option fits the campaign, make the response instruction easy to understand. A dedicated phone route can also help distinguish campaign calls when it’s set up for that purpose.
Use a distinct campaign identifier for each mailing or test group. It could be a unique QR destination, text instruction, or phone route. Keep the identifier consistent from the mail piece through your response records. If you change the creative or offer, assign a separate identifier so the resulting activity isn’t blended with another version.
Turn campaign activity into a useful report
Build the report around separate events, not one blended “engagement” total. Record the number of pieces mailed, available delivery updates, trackable responses, and completed conversions in separate fields. Define each calculation clearly. For instance, note whether a response rate uses pieces mailed or pieces reported delivered as its denominator. Those bases aren’t interchangeable.
Set a tracking window before launch and use the same window when comparing similar campaigns. Record when the mailing entered delivery and when response actions occurred. This helps you interpret timing without claiming that delivery updates prove readership or that every response came from the mail.
Include limitations in the report. A QR scan captures a scan, not every reader. A call or text count captures activity through that route, not responses that came another way. If a customer could have encountered other marketing, state how you handled attribution. Clear assumptions make the results more useful, even when they limit what you can conclude.
For the fairest comparison, keep the objective, audience approach, response mechanism, attribution rules, and reporting window consistent. If one campaign measures inquiries and another measures purchases, report them as different outcomes rather than ranking them on a single scale.
Ready to build measurement into a direct mail campaign? Plan a trackable direct mail campaign.
How We Mail America Connects Direct Mail With Measurable Responses
We Mail America is a nationwide, full-service direct mail advertising company. Campaign support brings design, printing, routing, mailing, and tracking together, helping businesses connect a tangible piece in the mailbox with a defined next step. The goal isn’t to claim that every recipient opened or read the mail. It’s to make customer actions easier to track and interpret.
Every direct mail campaign includes a custom QR code, and postcards include a text response option at no additional charge. These tools give recipients a clear way to act and give marketers a way to record certain responses. Delivery updates provide information about mail progress, not confirmation that an individual opened or read a piece. Keep those measures distinct when reviewing campaign results.
Connect mailbox delivery with digital response options
A QR code can connect a mail piece to a campaign destination. If that destination invites a specific action, such as submitting an inquiry, the campaign can record scans and the resulting action separately. A scan signals an interaction with the code, not necessarily a lead or sale. A postcard’s text option offers another direct response path, with text activity measured as its own event.
We Mail America also offers digital advertising options, including targeted email and Connected TV. These channels can complement direct mail by extending a campaign across physical mail and screens. Keep each channel’s response data identifiable so reports show which actions are associated with each campaign path. No channel guarantees a particular outcome.
Make the next campaign easier to measure
Start with the objective. If the goal is to generate inquiries, define what qualifies as an inquiry and choose the response route that captures it. If the goal is a completed purchase, track that outcome separately from scans, texts, and calls. This keeps the report tied to the result the campaign was designed to achieve, rather than relying on a broad engagement label.
Then set the measurement rules before launch. Decide which campaign identifier will distinguish the mailing, what period you’ll use to collect responses, and how you’ll connect a response to a later conversion. Report pieces mailed, delivery progress, recorded responses, and completed outcomes as separate measures. Direct mail open rates can’t tell you exactly who read a mail piece, but a defined response path can show which measurable actions followed.
With design, printing, routing, mailing, and tracking handled as part of full-service support, We Mail America helps organize the moving parts of a direct mail campaign. Build your plan around one clear objective and a trackable customer action, then plan a trackable direct mail campaign.
Turn Your Next Mailing Into a Smarter Test
Let your next campaign answer a focused business question. Instead of chasing a higher direct mail open-rate figure, decide what you want to learn: which offer earns more inquiries, which message prompts action, or which audience responds to a particular approach. A clear test gives your next decision a practical basis.
Keep the test manageable. Change one major element at a time, such as the offer or creative, and use the same success measure across versions. Then apply what you learn to the next campaign. Over time, this creates a more useful picture of what moves your customers to act than an isolated percentage can provide.
We Mail America can help shape a nationwide direct mail campaign around a defined objective and a response path that fits it. Bring your next campaign idea forward, and make measurement a practical part of the plan.
Plan your trackable direct mail campaign and take the next step with confidence.
Frequently Asked Questions
Can direct mail have an open rate?
Yes, a source can report a readership estimate or call it an open rate, but the label doesn’t mean each physical piece sent an opening signal. Direct mail open rates may come from surveys or another stated estimation method. By contrast, a QR scan or reply is a recorded action. Before using a figure in a campaign report, check what “open” means, how the source calculated it, and which pieces or people it included.
How can I tell whether someone read my direct mail postcard?
You usually can’t confirm that a specific person read a postcard from delivery information alone. Instead, make the desired next step trackable. For an appointment campaign, for example, invite recipients to scan a code or use a dedicated response route, then count appointment requests through that route. Scans, texts, calls, and offer redemptions show recorded engagement, but they won’t reveal everyone who noticed the card and chose not to respond.
Are direct mail open rates the same as response rates?
No. A reported open or readership rate estimates attention, while a response rate counts recipients who take a defined action, such as requesting information. A conversion rate tracks how many responses complete the campaign’s intended outcome, such as booking an appointment. Those percentages answer different questions. Before comparing figures, check each source’s formula and denominator. Otherwise, a readership estimate could be mistaken for a count of people who acted.
Do QR code scans count as direct mail opens?
No. A QR scan is a trackable interaction, not a verified open or proof that someone read the entire mail piece. It can show that a person scanned the code and reached its linked destination. To make the result useful, assign a campaign-specific code and report scans separately from other outcomes. If the visitor then submits a form or completes a purchase, record that as a separate action rather than treating it as part of the scan count.
How do I compare direct mail open rates across different campaigns?
Compare reported rates only when their definitions, audiences, campaign types, and measurement methods align. Keep estimated readership separate from recorded responses and completed conversions. For an external benchmark, note the source and publication date; for internal results, document the calculation and assumptions. If one campaign uses a survey estimate and another counts QR scans, call them non-comparable. That’s more useful than naming a winner based on percentages that measure different events.
Can I measure direct mail engagement without tracking individual opens?
Yes. Choose actions that fit the campaign, such as QR scans, text replies, calls, or offer redemptions, and record them within a defined reporting window. You can review response activity alongside delivery updates without identifying every reader. For example, a campaign promoting consultations might count requests made through its designated route. The result reflects recorded actions, not everyone who read the mail or was influenced by it.
Does mail delivery tracking show when a recipient opens a postcard?
No. Delivery tracking provides information about mail progress; it doesn’t report whether a particular person opened or read a postcard. You can compare delivery timing with the dates responses come in to understand when activity begins, but that timing doesn’t prove who saw the piece or what caused the response. Keep delivery updates and engagement counts in separate report fields so the results don’t claim more than the tracking can show.